


Edge-first detection
All anomaly detection logic runs on the probe device itself. The system identifies and classifies faults locally — upstream reporting only happens when something actionable is found, keeping bandwidth usage minimal and detection latency under 100ms.
Automotive protocol fluency
The monitoring stack speaks the languages of automotive networks natively — CAN, LIN, automotive Ethernet (100BASE-T1), and SOME/IP — enabling diagnostics that generic IT monitoring tools simply cannot perform.
Zero-touch deployment
Probes are designed for tool-free installation and automatic registration. Drop a unit into a network segment and it begins reporting within minutes, no manual configuration required.
NOC-ready output
Diagnostics data is structured for direct ingestion by existing operations dashboards. No custom integration work required on the operator side.
Embedded & Firmware Layer
- Platform: ARM Cortex-A (Linux) + Cortex-M co-processor for real-time tasks
- OS: Yocto-based Embedded Linux with real-time kernel patches
- Automotive interfaces: CAN FD, automotive Ethernet (100BASE-T1), LIN
- Watchdog, self-recovery, and remote firmware update over secure channel
Communication & Protocols
- MQTT for lightweight telemetry to cloud backend
- SOME/IP and DDS for in-vehicle network diagnostics
- AUTOSAR-compatible diagnostic interfaces (UDS over CAN / Ethernet)
- TLS 1.3 encrypted transport for all upstream communication
Backend & Infrastructure
- Time-series database: InfluxDB for metrics retention and trending
- Alerting: configurable threshold engine with escalation routing
- REST API for third-party NOC and fleet management platform integration
Integrations
- Grafana-based operations dashboards
- OEM telematics back-end systems
- JIRA / PagerDuty webhook alerting
Operational Efficiency
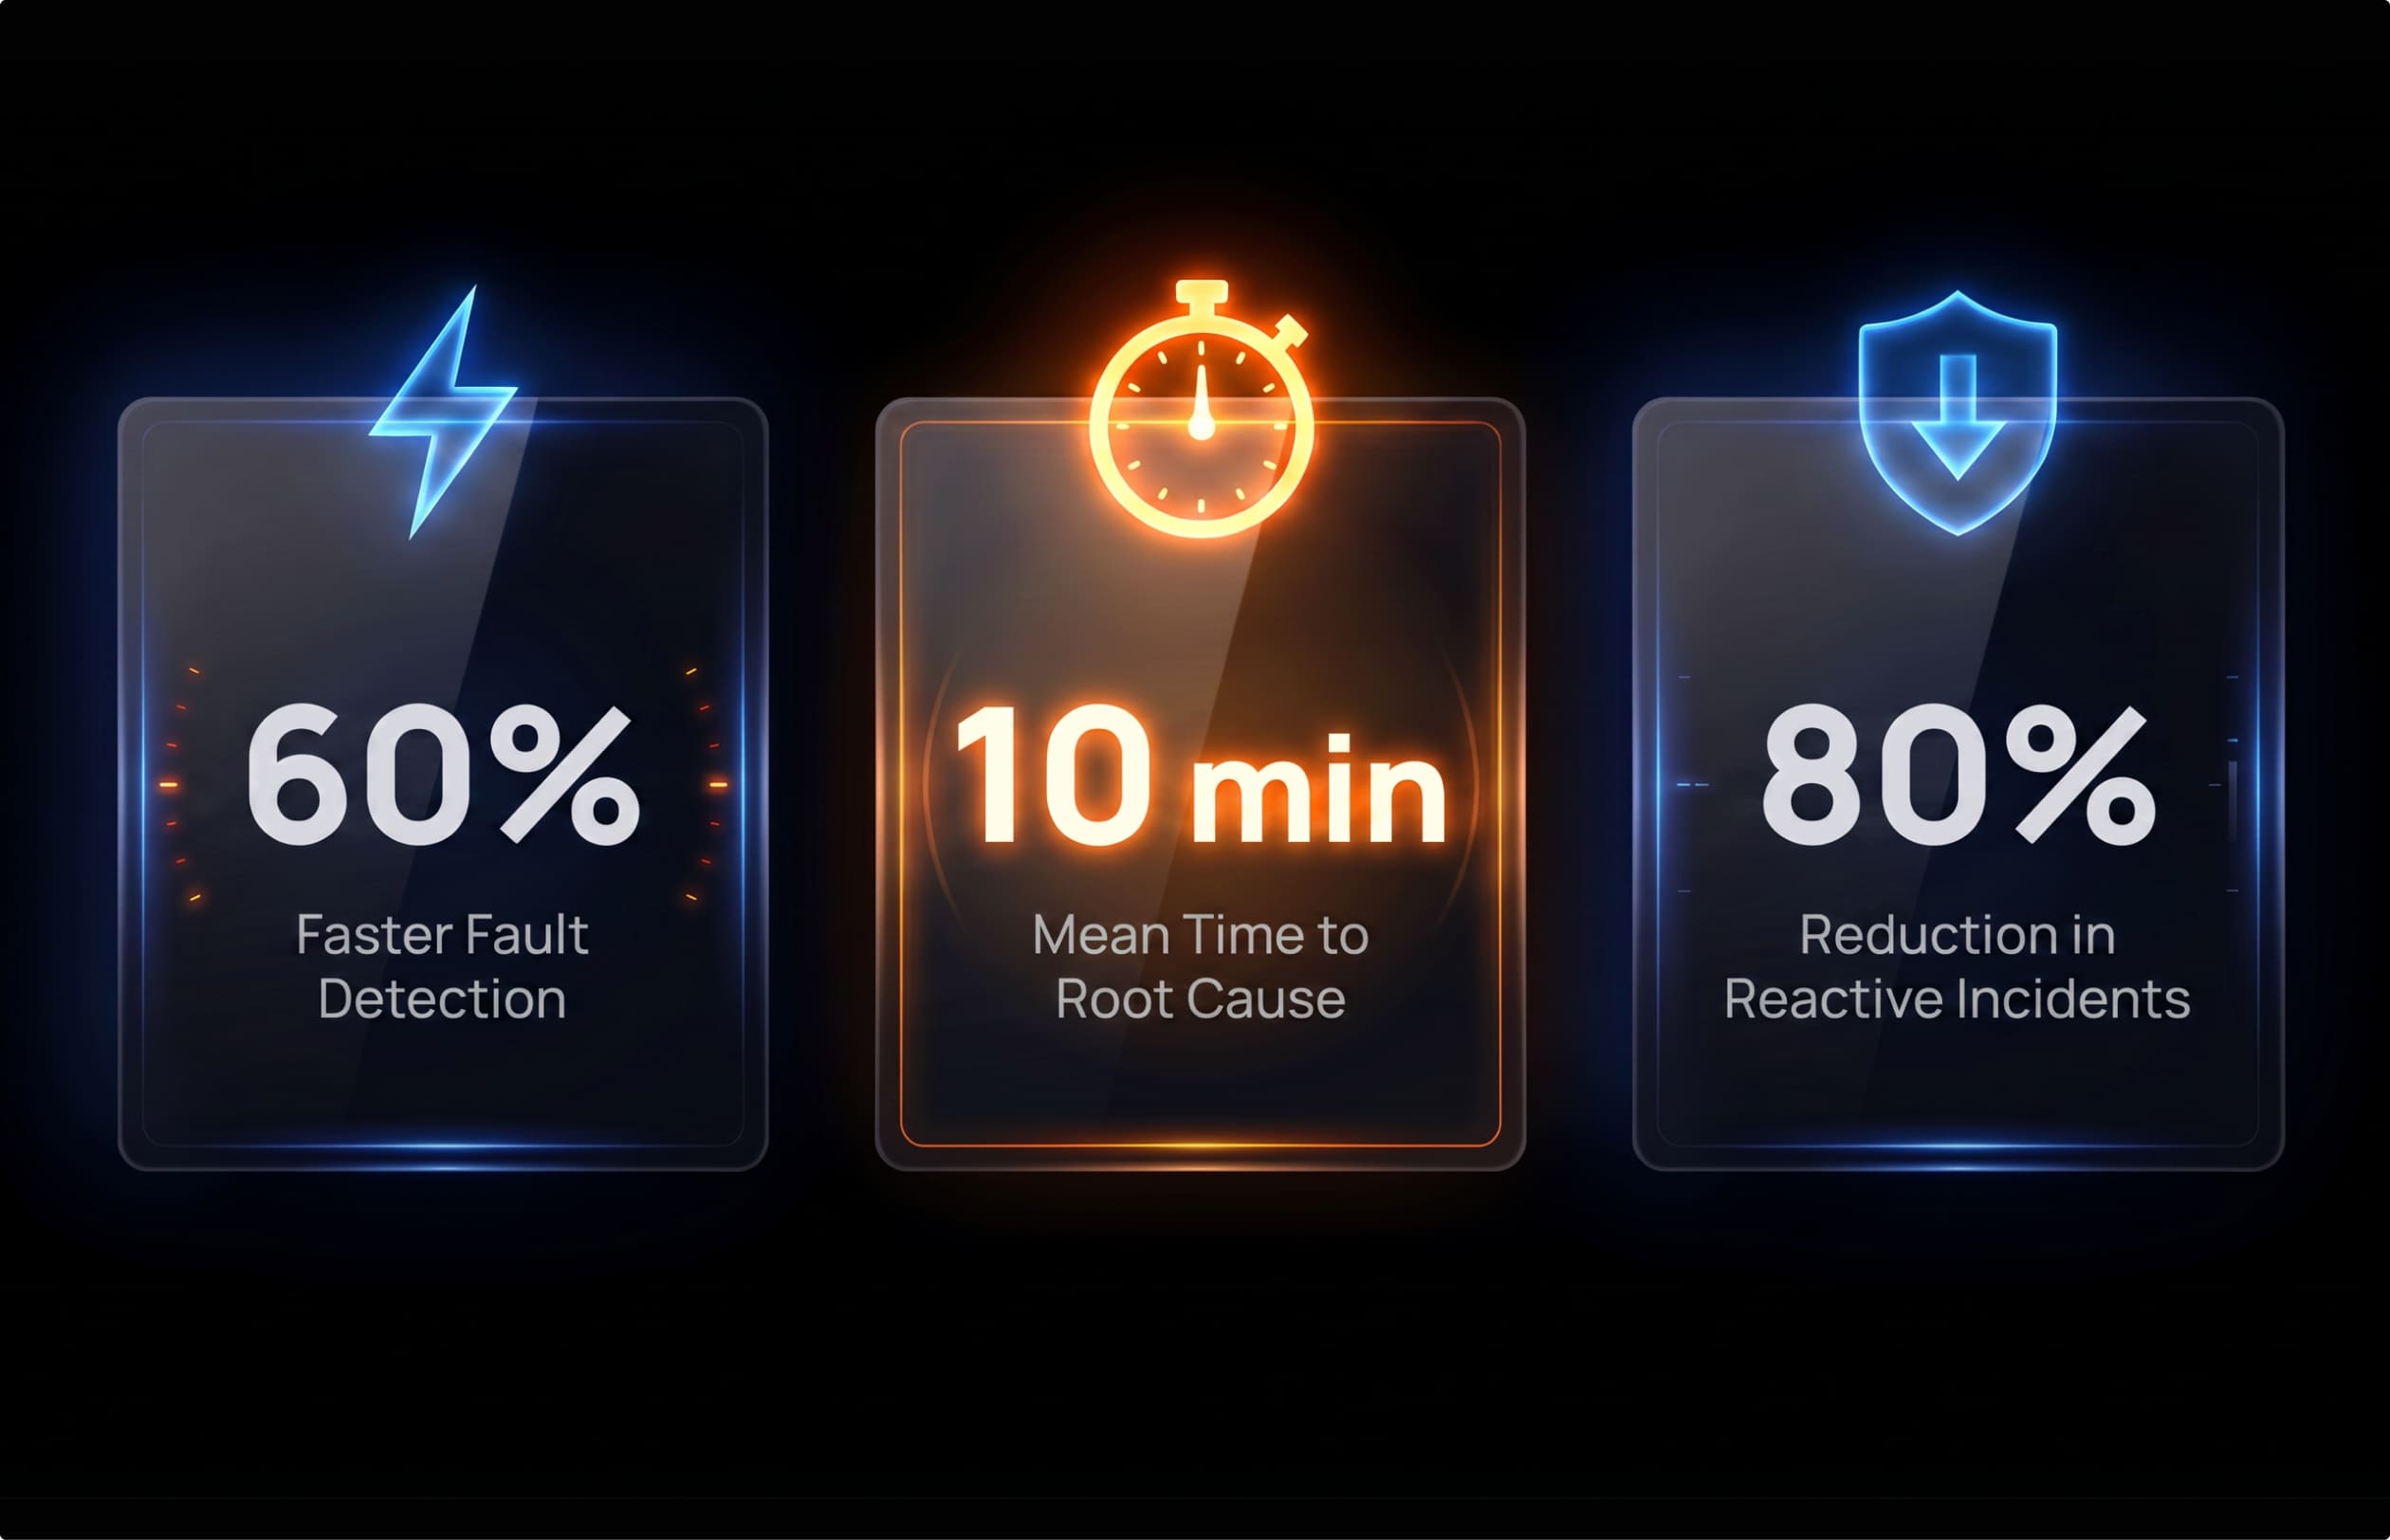
NOC teams eliminated manual polling routines entirely. Engineers now respond to structured, prioritized alerts instead of hunting through raw logs — cutting mean response time from hours to minutes.
Diagnostics Quality
Per-node, per-protocol diagnostics surface failure patterns that aggregate monitoring tools miss completely. Intermittent CAN bus errors, Ethernet frame loss spikes, and timing violations are caught at the source before they propagate to vehicle-level symptoms.
Scalability
New network segments and probe units are added without touching the backend. The architecture handles hundreds of simultaneous probe nodes with linear scaling.
