
A sales dashboard that reports a revenue drop answers one question. Finding the cause of the drop, estimating next quarter's figure, and deciding which price or inventory change to make each answer a different one, with different data, methods, and skills behind them. The 4 types of data analytics – descriptive, diagnostic, predictive, and prescriptive – correspond to those four questions. This guide explains how each type works, where it is used across business functions, which tools support it, and how an organization can decide what to adopt first.
What are the 4 types of data analytics?
The four categories are separated by the question each one answers: what happened, why it happened, what is likely to happen, and what action should follow. They are usually drawn as a ladder in which both difficulty and potential decision value rise at every step.
How data analytics turns raw data into business decisions
Records from transactional systems, sensors, web events, and spreadsheets mean little until they are collected, cleaned, joined, and interpreted. Data analytics in business covers that whole chain: ingestion into a warehouse or lake, transformation into consistent definitions, analysis, and delivery to the person or system that makes a decision.
The difference between data analysis and data analytics
Data analysis is the act of examining a dataset to reach a conclusion, such as calculating average order value for one month. Data analytics is the wider discipline around it: preparing data, selecting data analysis techniques, building repeatable pipelines, and applying results to recurring decisions. In everyday usage the labels overlap, and the four types of analysis described here are discussed under either name.
How the four types of analytics work together
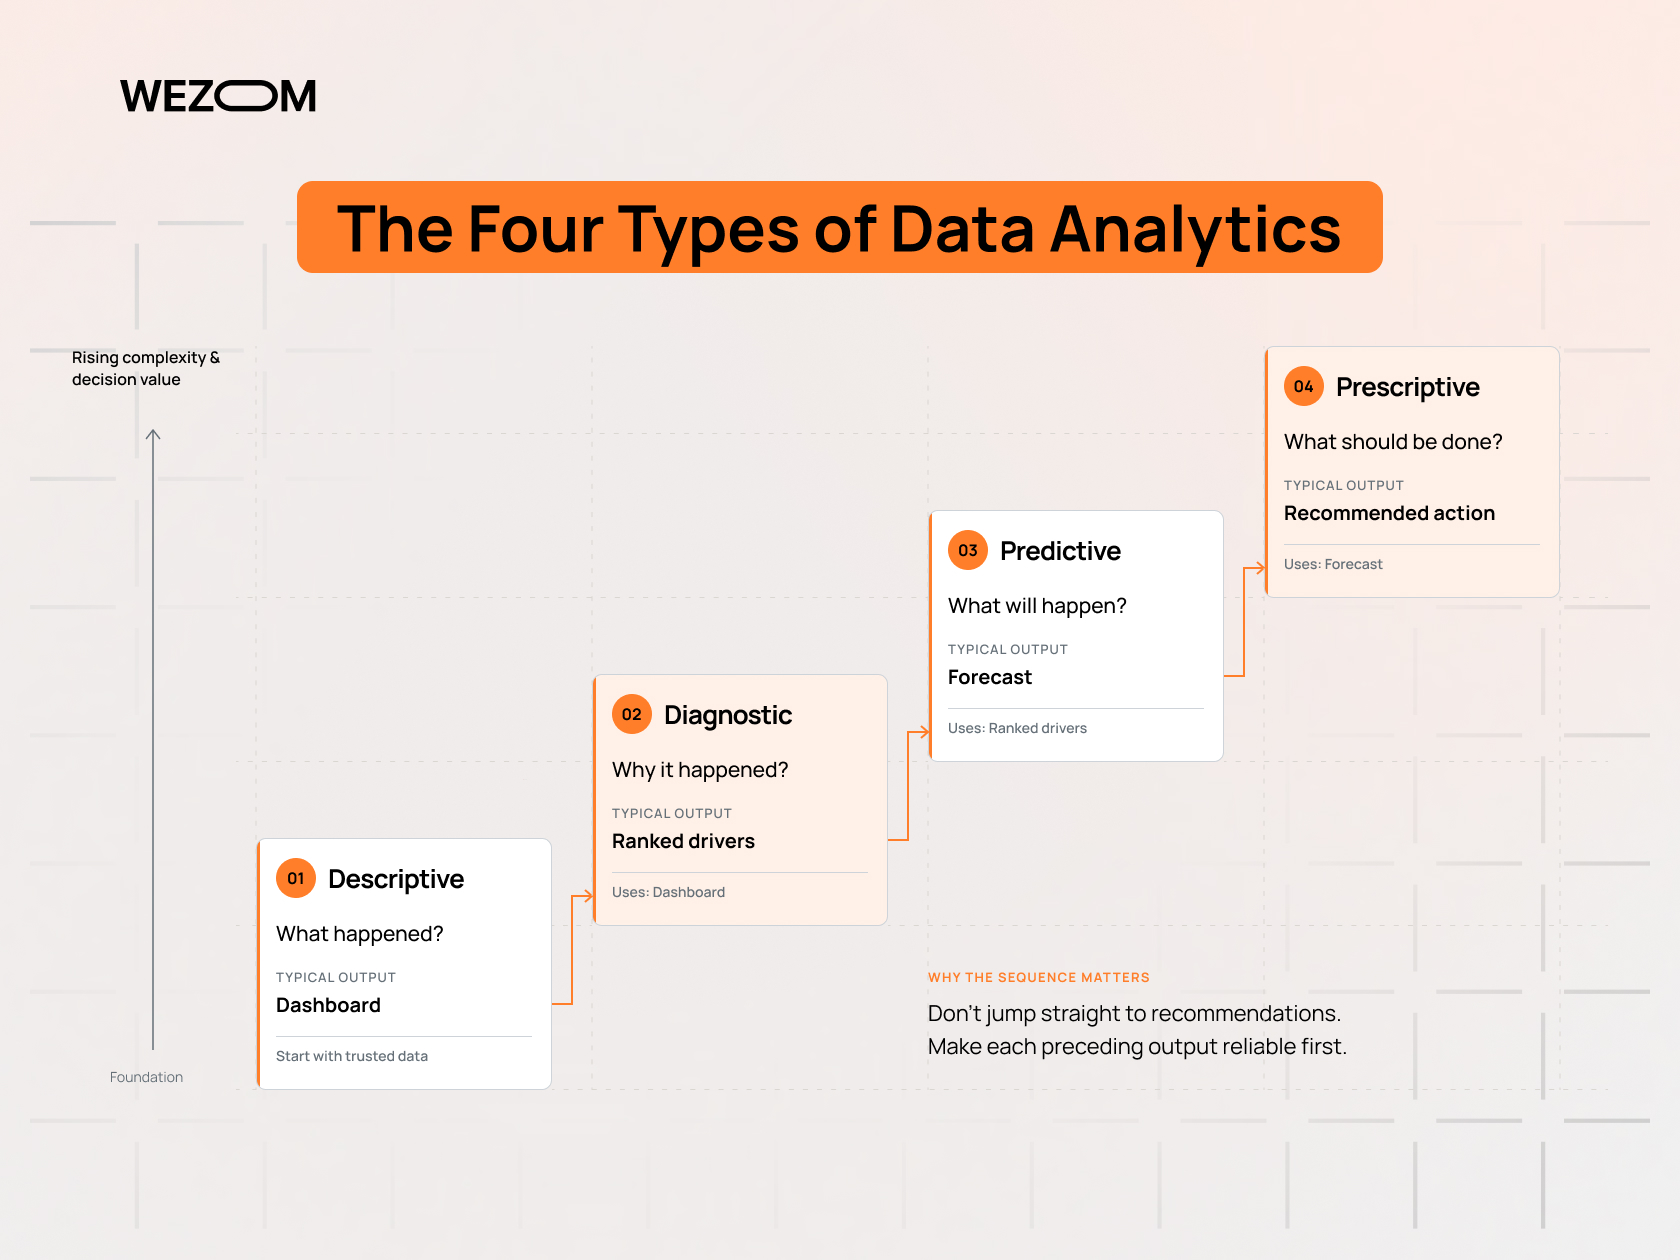
Each type consumes the output of the one before it. Descriptive reporting establishes trusted metrics, diagnostic work explains movements in those metrics, predictive models use the identified drivers as features, and prescriptive methods feed the resulting estimates into an optimization or rule engine that proposes an action. The sequence of descriptive, diagnostic, predictive, and prescriptive analytics is more of a dependency chain than a menu.
Descriptive analytics: Understanding what happened
What is descriptive analytics and how does it work?
Descriptive analytics summarizes historical data into a form people can read: totals, averages, distributions, and trends over time. It aggregates records along dimensions such as period, region, product, and customer segment, then presents the results as reports or dashboards. The method is deterministic, so reliability depends on the semantic layer. If two teams calculate revenue differently, the dashboard displays a disagreement rather than an insight.
Common descriptive analytics techniques and metrics
Core techniques include aggregation, period-over-period comparison, cohort tables, and frequency distributions. Typical business performance metrics are revenue, gross margin, average order value, conversion rate, on-time delivery rate, churn rate, and inventory turnover.
Descriptive analytics examples in business
A finance team reviewing the monthly close compares actual spend with budget by cost center and flags the lines that exceeded plan. These descriptive analytics examples share one trait: they record outcomes without explaining them, which is exactly their scope.
Popular descriptive analytics tools and dashboards
Excel and Google Sheets cover small datasets. Power BI, Tableau, Looker, and Qlik dominate dashboarding, while Metabase and Apache Superset serve teams that prefer open-source options. Behind them usually sits a warehouse such as Snowflake, BigQuery, or Redshift, plus dbt to keep metric definitions under version control.
Benefits and limitations of descriptive analytics
Descriptive reporting is inexpensive to build, easy to audit, and understood by nearly every stakeholder. Its limits are structural. A report shows that a metric has changed but does not explain why. It looks backward, and late-arriving records quietly change last week's figures.
Diagnostic analytics: Finding out why something happened
What is diagnostic analytics?
Diagnostic analytics investigates the reasons behind a result seen in descriptive reporting. The analyst starts from a deviation, such as a revenue decline or a spike in returns, and tests hypotheses by slicing the data, comparing segments, and checking which variables move together. The output is an explanation, ideally with a quantified contribution for each factor.
Root cause analysis, drill-down, and data discovery techniques
Drill-down moves from a summary figure to its underlying dimensions – for example, from national revenue to region, account tier, and product line. Root cause analysis structures the search with methods such as the five whys, while statistical support comes from correlation analysis, variance decomposition, and hypothesis testing.
Diagnostic analytics examples in sales, operations, and finance
In sales, a falling win rate can be isolated by comparing deals before and after a price change within the same segment. In operations, a rise in late shipments can be traced to one carrier lane and one warehouse shift. In finance, a margin shortfall can be separated into price, volume, mix, and cost effects through variance analysis. These diagnostic analytics examples all end in a statement of cause that a manager can act on.
Tools used for diagnostic data analysis
Drill-through pages, decomposition trees, and key-influencer visuals in Power BI support the first pass, and Tableau and Qlik offer comparable features. SQL and Python or R notebooks handle deeper statistical work, and process mining platforms reconstruct event logs to show where workflows deviate.
Challenges and limitations of diagnostic analytics
The cause of a problem often sits in a system that was never connected to the reporting layer, such as a marketing platform or a call-center log. Observational data seldom proves causation, and the work is manual enough to limit how many questions can be investigated.
Predictive analytics: Forecasting what is likely to happen
What is predictive analytics and how does it work?
Predictive analytics estimates the probability or value of a future outcome by learning patterns from historical data. The workflow defines a target variable, engineers features, trains a model on past examples, validates it on unseen data, and scores new records. Outputs are probabilities or ranges. A churn probability of 0.7 means similar customers left roughly seven times out of ten in the training data, not that this customer will leave.
Predictive modeling, machine learning, and statistical forecasting
Statistical modeling and machine learning algorithms overlap but differ in emphasis. Regression analysis and time series analysis methods such as ARIMA and exponential smoothing give interpretable forecasts for demand and revenue. Classification models, including logistic regression, random forests, and gradient boosting, estimate outcomes such as default or churn. Business forecasting at SKU level often pairs a statistical forecasting baseline with machine learning corrections that add promotion, price, and weather signals.
Predictive analytics examples across industries
Retailers forecast demand per store to set replenishment quantities, banks score loan applicants for default probability, and subscription companies rank accounts by churn risk. Manufacturers estimate the remaining useful life of equipment from vibration and temperature readings. These predictive analytics examples share a structure: a historical outcome label, a set of explanatory features, and a decision that benefits from advance notice.
Predictive analytics tools and technologies
Python with scikit-learn, XGBoost, and statsmodels remains the working standard for custom models. Cloud platforms such as Azure Machine Learning, Amazon SageMaker, and Google Vertex AI cover training, deployment, and monitoring, and their AutoML features lower the entry barrier for standard tabular problems.
Benefits, limitations, and data quality requirements
Accurate forecasts move decisions earlier, when options are still inexpensive. Models need enough labeled history, consistent definitions over time, and features that will be available at prediction time. Sparse history and structural breaks such as a pricing overhaul limit reliability, so data quality management should precede model tuning.
Prescriptive analytics: Determining what should happen next
What is prescriptive analytics?
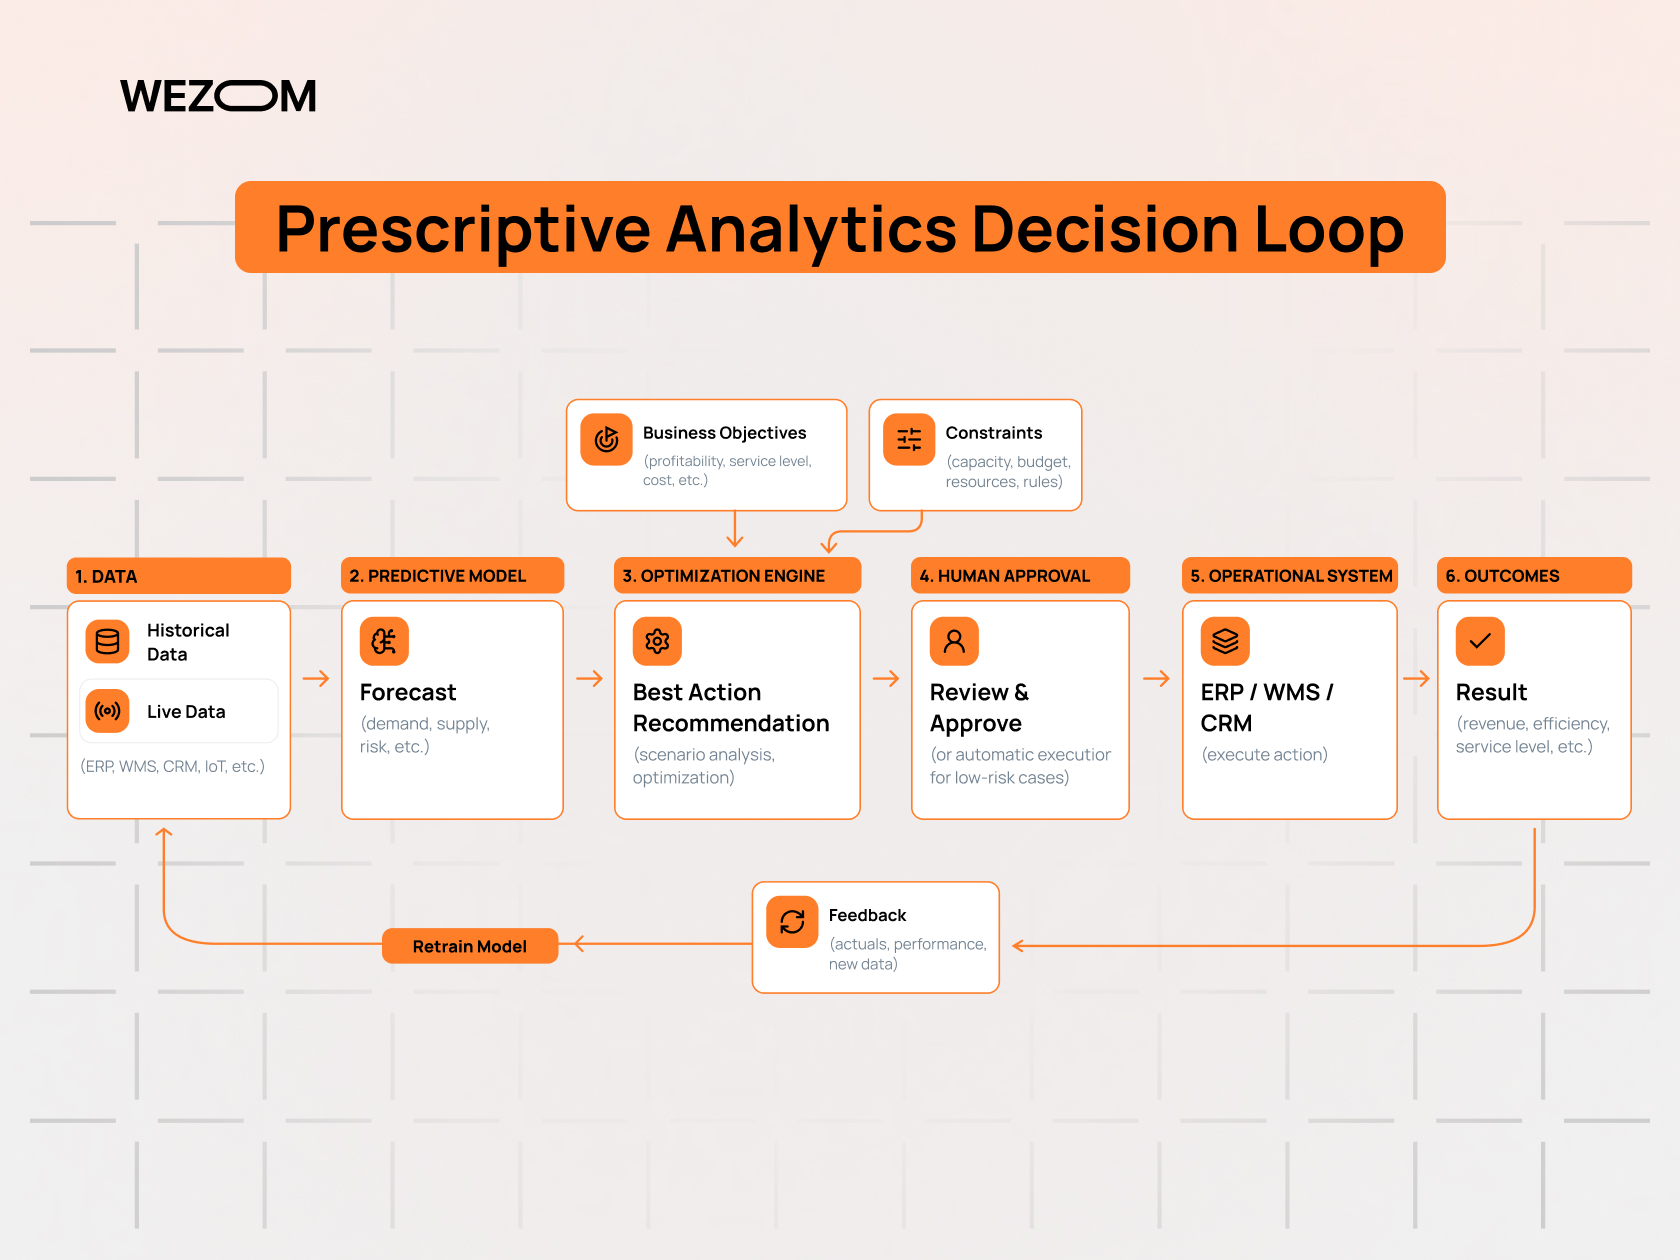
Prescriptive analytics recommends a specific action that achieves a stated objective under stated constraints. A forecast says that demand will rise; a prescriptive output specifies how much to order, where to stock it, and at what price. The method combines predictions with business rules, costs, and capacity limits, which makes it the layer where analytics connects directly to operations.
How optimization, simulation, and AI support decision-making
Optimization algorithms such as linear and mixed-integer programming search for the best allocation under constraints, for instance minimizing delivery cost subject to vehicle capacity and time windows. Simulation modeling, including Monte Carlo methods, evaluates a policy under uncertainty, and scenario analysis compares alternatives such as a supplier outage. Reinforcement learning supports high-volume repeated decisions like pricing or offer selection, while rule engines encode the policy limits the optimizer must respect.
Prescriptive analytics examples in real-world business scenarios
Airline and hotel revenue management adjusts prices from demand forecasts and remaining inventory. Delivery operators generate routes that respect time windows, driver hours, and vehicle capacity, and hospitals schedule operating rooms against predicted admissions. In each of these prescriptive analytics examples, the output is a plan or an action that a person or a connected system then executes.
Prescriptive analytics tools and platforms
Solvers such as Gurobi, CPLEX, OR-Tools, and HiGHS handle optimization, with Python libraries like PuLP and Pyomo used for modeling. Supply chain planning suites from vendors including Kinaxis, o9 Solutions, and SAP IBP embed optimization into planning workflows, and workflow automation carries recommendations into ERP, WMS, or CRM systems.
Challenges of implementing prescriptive analytics
Recommendations are only as good as the predictions, objective function, and constraints behind them. An optimizer exploits any rule that was left out and can return plans that are mathematically optimal and operationally impossible, so domain experts must help encode constraints. Integration with execution systems is frequently the hardest part, and planners override recommendations they cannot explain.
Descriptive vs. diagnostic vs. predictive vs. prescriptive analytics
Comparison of the 4 types of data analytics by purpose, methods, and outputs
The table summarizes how the types of business analytics differ in the question answered, the usual methods, and the output the user receives.
| Type | Core question | Typical methods | Typical output | Example |
|---|---|---|---|---|
| Descriptive | What happened? | Aggregation, trend analysis, visualization | Reports, dashboards | Monthly revenue by region |
| Diagnostic | Why did it happen? | Drill-down, correlation analysis | Ranked drivers | Win-rate drop traced to one segment |
| Predictive | What is likely to happen? | Regression, time series, machine learning | Forecasts, probability scores | Churn risk per account |
| Prescriptive | What should be done? | Optimization, simulation, rules | Recommended actions | Delivery routes under constraints |
Predictive vs. prescriptive analytics: Key differences
Predictive vs prescriptive analytics comes down to output and accountability. A predictive model estimates an outcome and leaves the decision to people, while a prescriptive system proposes the decision itself and therefore needs an objective, constraints, and a way to evaluate alternatives. A churn score is predictive; choosing which retention offer goes to which customer within a campaign budget is prescriptive. Prescriptive systems nearly always embed predictive models.
Descriptive vs. diagnostic analytics: Reporting vs. root cause analysis
Reporting is a standing product, refreshed on a schedule for a broad audience. Root cause analysis is an investigation triggered by an anomaly and carried out by an analyst with access to detailed data. The gap in descriptive vs predictive analytics is larger, since summarizing recorded events differs fundamentally from estimating events that have not occurred, but descriptive and diagnostic work share data and tools. The practical dividing line is whether the user reads a result or interrogates it.
How analytics maturity influences the choice of methods
An analytics maturity model typically runs from ad hoc spreadsheet reporting, through governed self-service BI, to operational machine learning and automated decision-making. Which types of data analytics an organization can support reliably depends on its weakest prerequisite, usually data quality rather than tooling.
Different types of analytics across business functions
Different types of analytics tend to appear in combination inside a single function, as the examples below show.
Retail and ecommerce: Customer behavior, demand forecasting, and pricing
Descriptive dashboards track sales, basket size, and conversion by channel. Customer behavior analysis segments shoppers by recency, frequency, and spend, and diagnostic work explains drop-offs at specific funnel steps. Demand forecasting sets replenishment quantities, while prescriptive pricing engines choose prices and markdown timing within margin floors.
Finance and banking: Fraud detection, risk analysis, and credit decisions
Fraud detection models score each transaction against the customer's normal behavior, which requires real-time data processing, while credit scorecards estimate default probability for risk assessment. Prescriptive logic then sets credit limits and pricing within regulatory constraints. Explainability matters here, since adverse credit decisions often have to be justified to applicants and regulators.
Logistics and supply chain: Inventory optimization and delivery planning
Descriptive metrics include on-time-in-full rate and stock turns, and diagnostic analysis traces late deliveries to specific lanes or carriers. Predictive models forecast demand and arrival times, and prescriptive optimization sets safety stock levels, allocates inventory across warehouses, and builds routes that respect delivery windows. The outputs have to reach WMS and TMS platforms, so integration quality largely determines whether recommendations are implemented.
Healthcare: Patient trends, predictive insights, and resource allocation
Hospitals report admissions, length of stay, and readmission rates, then investigate variation between units. Predictive models estimate admission volumes or no-show probability, and prescriptive scheduling allocates beds, operating rooms, and staff against the forecast. Privacy regulation and clinical validation slow deployment, and any model that influences care needs clinician oversight.
Manufacturing: Quality monitoring and predictive maintenance
Statistical process control charts and defect rates form the descriptive layer, and diagnostic analysis correlates defects with machine settings, material batches, and shifts. Predictive maintenance models use vibration and temperature signals from IoT sensors to estimate failure probability, and prescriptive scheduling decides when to take a machine offline given production commitments.
Predictive and prescriptive analytics tools: How to choose the right solution
Business intelligence platforms vs. advanced analytics software
BI platforms are built for governed reporting, self-service exploration, and visualization of structured data, so they serve descriptive work and much of diagnostic work. Advanced analytics software, including data science workbenches, ML platforms, and optimization solvers, supports model development, deployment, and monitoring.
Built-in analytics, low-code tools, and custom analytics solutions
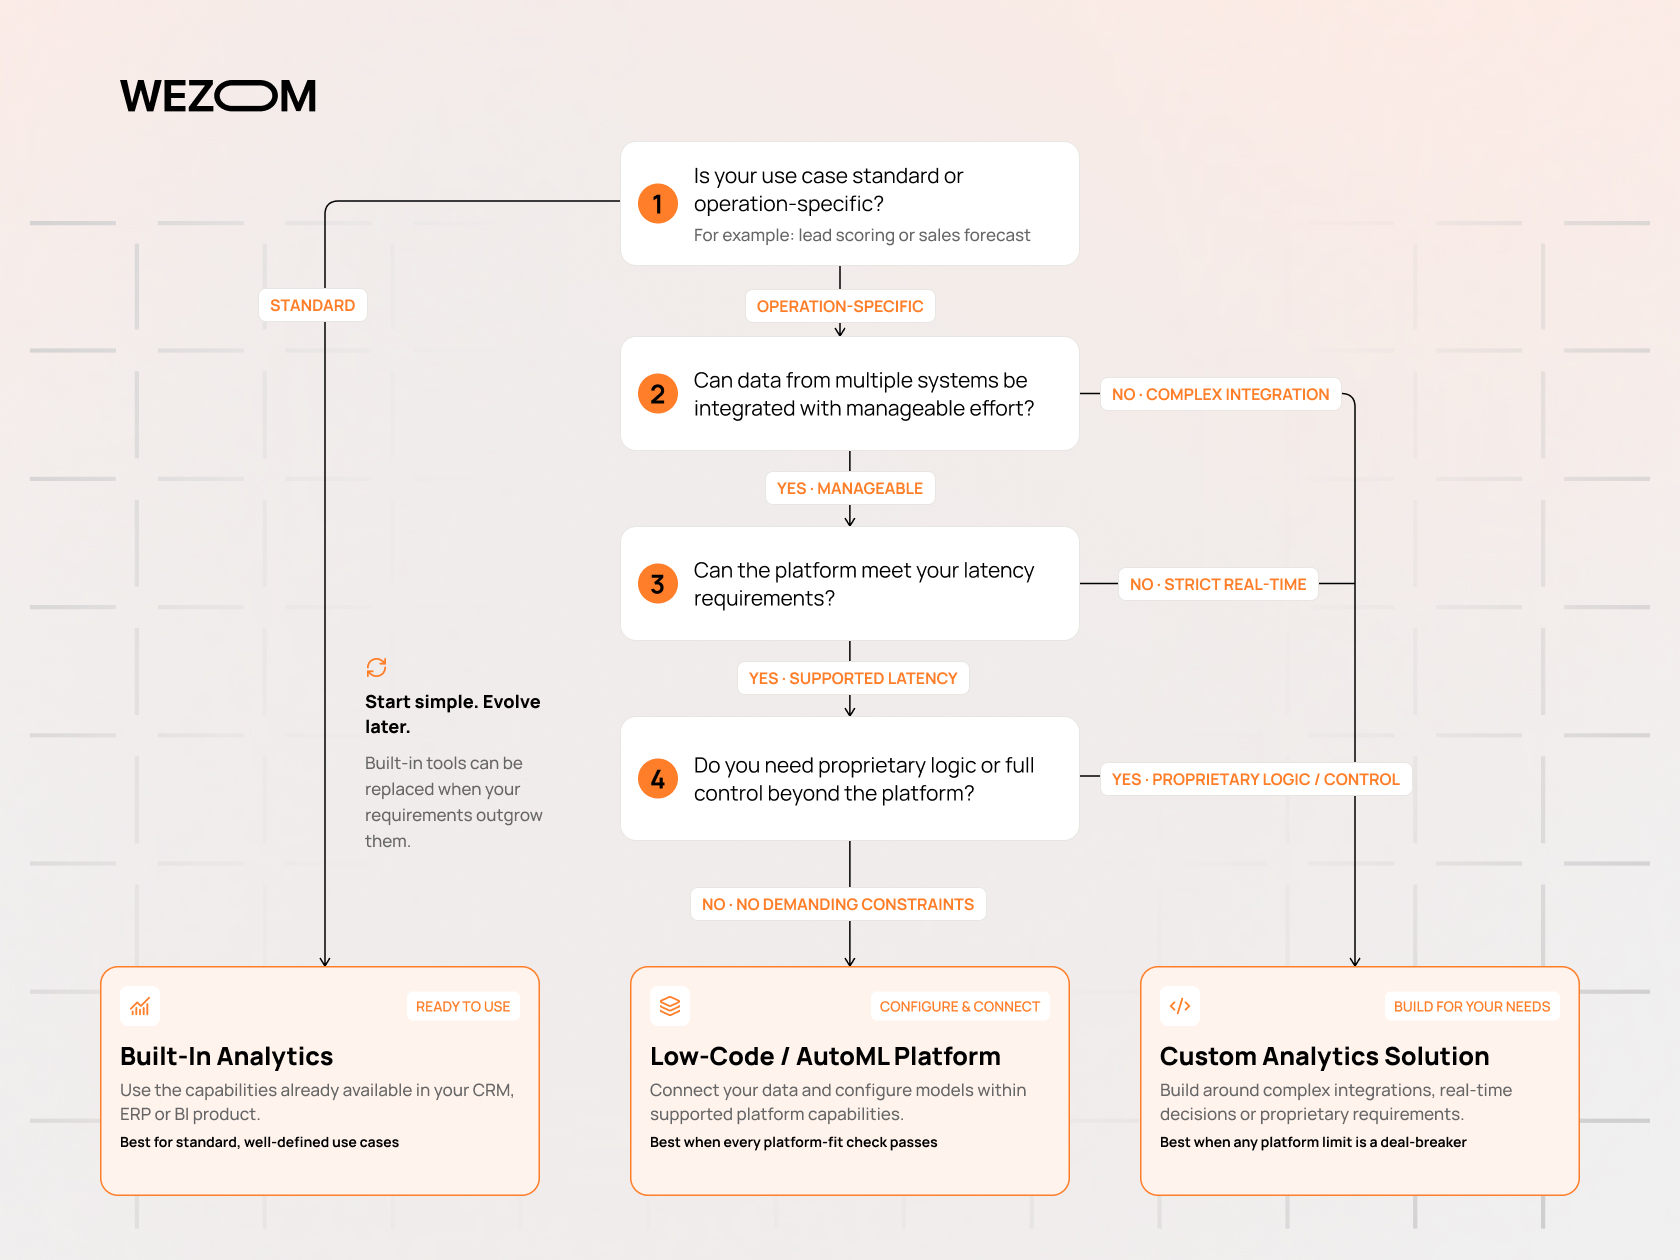
Built-in features in CRM, ERP, and BI products offer the fastest start for standard cases such as lead scoring, though customization and model transparency are limited. Low-code and AutoML platforms suit tabular problems on clean data. Custom solutions make sense when the logic is proprietary, when data from several systems must be combined, or when optimization constraints are specific to the operation.
Key features to evaluate in predictive and prescriptive analytics tools
Evaluation should concentrate on the capabilities that decide whether a model survives production:
- Model transparency, meaning feature importance and explanations for individual predictions.
- Validation tooling such as backtesting and drift monitoring.
- For prescriptive use, constraint modeling with hard and soft limits, plus scenario comparison.
- Deployment options covering batch scoring and low-latency inference.
- Write-back support, so recommendations reach operational systems and user responses are captured.
Data integration, scalability, governance, and security requirements
Predictive and prescriptive analytics tools depend on connectors to ERP, CRM, WMS, and event streams, and on the ability to reproduce training datasets exactly as they were. Scalability matters for training on large histories and for scoring at volume, which the architecture should treat separately. Data governance defines ownership, lineage, and access, and for models it extends to version approval and audit. Security covers role-based access, encryption, and masking of personal data, with residency rules in regulated sectors.
Total cost of ownership and expected business value
License price is a minor part of the cost. Data engineering, integration, model monitoring, retraining, and user training usually exceed it over several years. Expected value should be tied to a measurable decision, such as fewer stockouts or lower write-offs, with a baseline recorded before deployment.
How to choose the right type of data analysis for your business
Identify the business problem and decisions analytics should support
The starting point is the decision, not the technique. A useful test names who will act on the result, what they will do differently, and how often. Last quarter's performance calls for descriptive reporting, and a drop in March conversion calls for diagnostic work. Next month's ticket volume is a predictive question, and the staffing plan that keeps waits under target at the lowest cost is a prescriptive one.
Assess data availability, quality, and infrastructure readiness
The assessment checks whether the required history exists, whether definitions stayed stable across it, and whether the same data will be available at the moment of prediction. Completeness, duplicates, latency, and the ability to join records across systems decide feasibility more than the choice of algorithm. Gaps found here shift the plan toward data engineering first.
Match analytics methods to business goals and team capabilities
A team of BI analysts can deliver descriptive and diagnostic work with SQL and dashboards, but predictive models require data science skills or vendor tooling, and prescriptive work requires operations research expertise. The goal sets the required rigor: an internal planning aid tolerates simpler models than a credit decision does.
Define KPIs and measure the impact of analytics initiatives
Each initiative needs a business KPI, such as stockout rate or churn reduction, and a model KPI, such as mean absolute percentage error or precision and recall. Impact measurement requires a baseline or a control group, because seasonal movement can mimic improvement.
How to implement the 4 types of data analytics
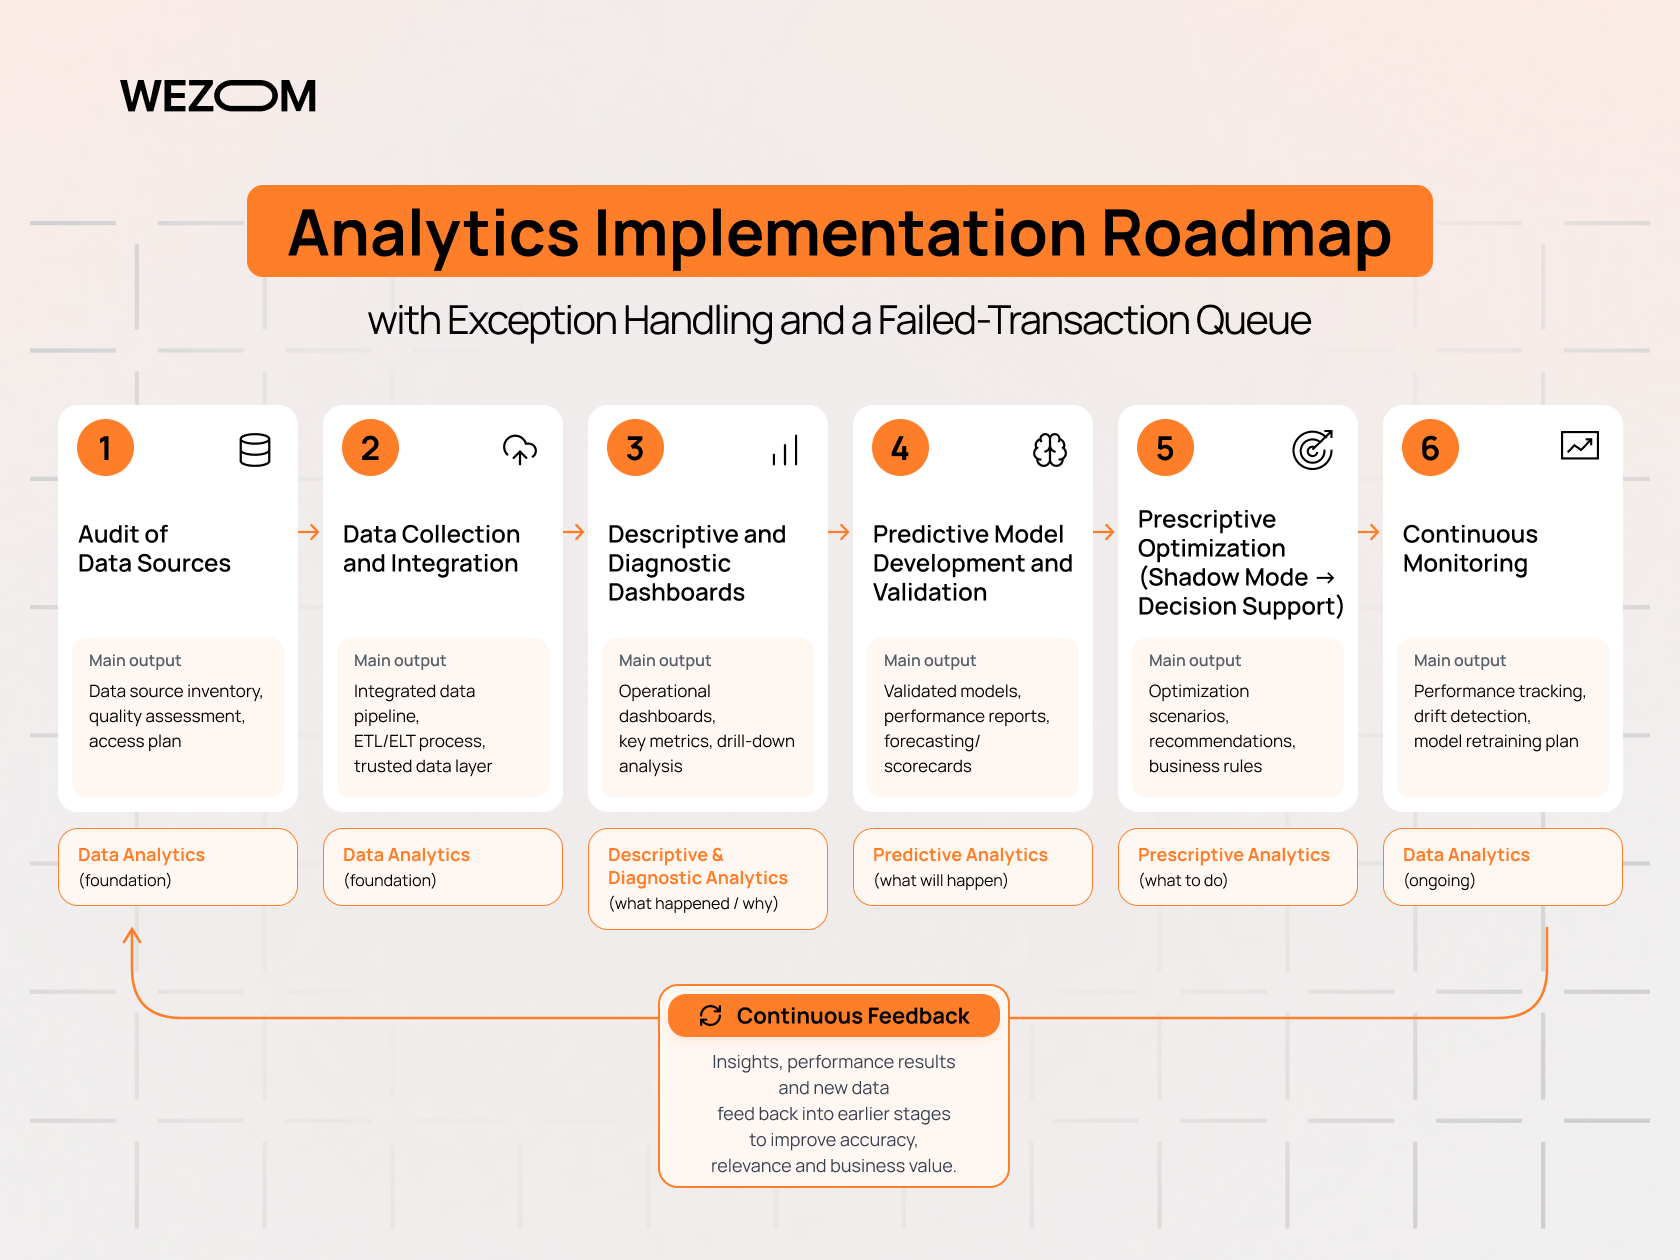
Implementation follows the dependency order of the types, although pilots for later stages can start while earlier ones mature.
Step 1: Audit data sources and existing analytics capabilities
The audit inventories systems, owners, data volumes, refresh frequency, and known quality problems, alongside existing reports and models. It usually exposes duplicate metric definitions and spreadsheet processes that carry undocumented business logic. The result is a prioritized list of use cases with their data dependencies.
Step 2: Establish data collection, cleaning, and integration processes
Pipelines move data from source systems into a central store, cleaning rules are applied, and master data such as customer and product identifiers is resolved. Data integration should be automated, with validation checks that fail loudly on schema changes or missing loads. Decisions about data collection and processing made here, including batch versus streaming, set the ceiling for later real-time use cases.
Step 3: Build descriptive dashboards and diagnostic reporting
Dashboards for core KPIs come first, followed by drill-through paths and variance views that support diagnostic questions. Threshold alerts shift the work from checking reports to responding to exceptions.
Step 4: Develop and validate predictive analytics models
The team selects a use case with a measurable decision and sufficient history, defines the target, builds features, and splits data by time rather than randomly. A naive baseline, such as last year's value, sets the bar the model has to beat. Deployment needs a scoring pipeline, monitoring, and a retraining plan, since a model that runs only in a notebook has no operational value.
Step 5: Introduce prescriptive models and decision optimization
Objectives and constraints are defined with the business owners, and the optimizer runs in shadow mode so its recommendations can be compared with actual decisions before anyone relies on them. The first release should be decision support with planner approval. Automation is added only where outcomes are low-risk and reversible.
Step 6: Monitor accuracy, adoption, and business outcomes
Monitoring tracks input data distributions, prediction error, and the business KPI, along with how often users accept or override recommendations. Consistent overrides in one region typically point to a missing constraint or a data problem.
Common mistakes when adopting different types of analytics
Using complex predictive models without a clear business case
Teams sometimes start from a technique and look for a problem. The result is a model with no decision attached, or a neural network where a regression baseline would have performed adequately and been easier to maintain. A model should earn its complexity by beating a simple baseline by a margin that matters in money or risk.
Confusing correlation with causation
Ad spend and sales may both rise in the holiday quarter without the spend causing the increase. Diagnostic findings from observational data are hypotheses, and consequential ones should be tested through A/B tests or other controlled experiments.
Ignoring data bias, model drift, and changing business conditions
Training data reflects past practice. If earlier credit approvals were skewed, a model trained on approved applicants inherits the skew and never sees outcomes for rejected ones. Model drift appears when the relationship between inputs and outcomes shifts after a price change, a new competitor, or a supply disruption. Drift monitoring, scheduled retraining, and fallback rules keep predictions aligned with current conditions.
Overlooking human oversight and explainability in automated decisions
Review thresholds, escalation paths, and override rights should be set per use case according to the cost of an error. Explainable AI techniques such as SHAP values and feature importance help users and auditors understand why a recommendation was made. Where a recommendation cannot be explained to the person responsible for the outcome, the process should keep a human decision in the loop.
FAQ
Which type of data analytics should a small business start with?
Descriptive analytics. A small business gets the most value from reliable reporting on sales, cash flow, and customer activity, using spreadsheets or a low-cost BI tool connected to its accounting and sales systems. A simple sales forecast becomes reasonable when several seasonal cycles of clean history exist and a decision like purchasing depends on it.
Can a company use all four types of analytics simultaneously?
Yes, and most mature organizations do so across different functions. Finance may rely on descriptive and diagnostic reporting, marketing on predictive scoring, and supply chain on prescriptive optimization. The constraint is dependency rather than simultaneity: each use case needs the layers beneath it to be reliable, and common metric definitions prevent teams from building conflicting versions of the same numbers.
Is machine learning necessary for predictive analytics?
No. Many predictive tasks are handled by statistical methods such as linear and logistic regression, exponential smoothing, and ARIMA, which are easier to interpret and need less data. Machine learning becomes useful when relationships are nonlinear, when many features interact, or when inputs are unstructured. A sensible approach benchmarks a simple statistical model first and adopts machine learning only if it delivers a material improvement.
What skills do professionals need for each type of data analytics?
Descriptive work calls for SQL, data modeling, visualization, and knowledge of business metrics. Diagnostic work adds statistics and the domain expertise to frame hypotheses. Predictive work requires Python or R, feature engineering, model validation, and basic MLOps. Prescriptive work adds operations research, optimization modeling, and the ability to translate operational rules into constraints.
How much historical data is needed for reliable predictive analytics?
No universal threshold exists, because the requirement depends on the volatility of the target, the seasonality, and the number of features. Annual seasonality needs enough cycles to observe repeating patterns, typically at least two full years. Data that predates a major structural change may need to be excluded, so recent relevant history can outweigh volume.
What is the difference between real-time analytics and predictive analytics?
Real-time analytics describes latency: data is processed and acted on as it arrives. Predictive analytics describes purpose: estimating future outcomes. The two are independent. A monthly demand forecast is predictive but not real time, and a live dashboard of current orders is real time but descriptive. They combine in fraud scoring, where a model estimates risk on each transaction within milliseconds, which requires streaming infrastructure and low-latency model serving.
Can generative AI replace traditional data analytics tools?
Generative AI complements them rather than replacing them. Natural language interfaces can generate queries, summarize dashboards, and draft analysis code, which lowers the barrier for descriptive and exploratory work. Governed data models and statistical validation remain necessary, since language models can produce plausible but incorrect figures without a trusted semantic layer.
